Proof single glyphs ↩
This example generates a proof of all selected glyphs in the current font (or all glyphs, if no glyph is selected), one glyph per page.
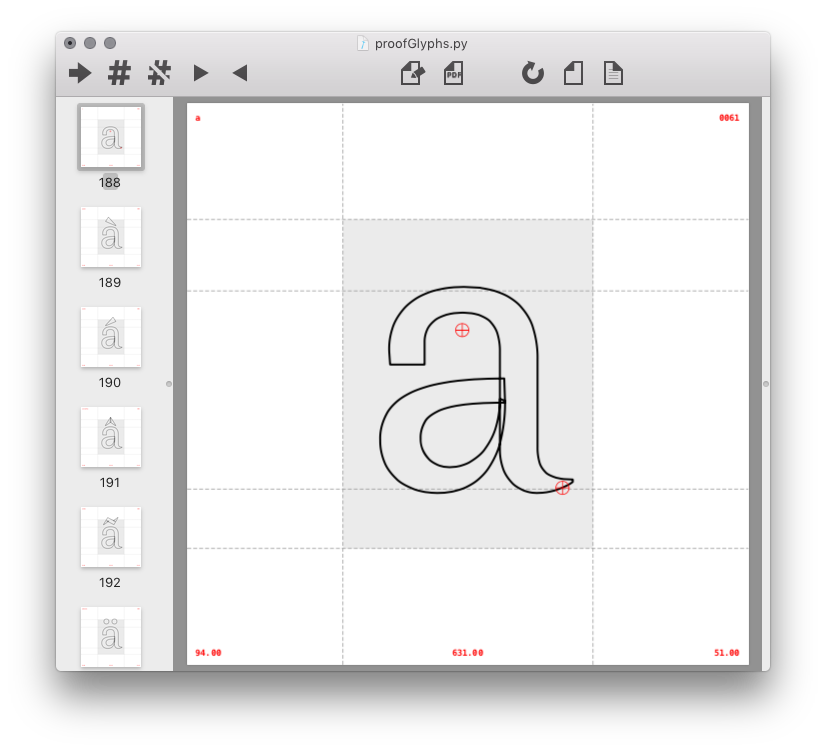
Each page shows a single glyph in the center of the page, and additional data such as font metrics, glyph box, anchors, glyph name, unicode, width, and left/right margins.
Page size, glyph scale, caption color and caption size can be adjusted in the variables at the top of the script.
'''Glyph Proofer'''

f = CurrentFont()

# settings
glyphScale = 0.6
canvasWidth = canvasHeight = 850
captionSize = 13
captionColor = 1, 0, 0

# collect vertical metrics
metricsY = {
    0,
    f.info.descender,
    f.info.xHeight,
    f.info.capHeight,
    f.info.ascender,
}

# get box height
boxHeight = (max(metricsY) - min(metricsY)) * glyphScale
boxY = (canvasHeight - boxHeight) * 0.5

# get glyph names
glyphNames = f.selectedGlyphNames if len(f.selectedGlyphs) else f.keys()

# draw glyphs
for glyphName in f.glyphOrder:
    if not glyphName in glyphNames:
        continue

    # get glyph
    g = f[glyphName]
    boxWidth = g.width * glyphScale

    # make new page
    newPage(canvasWidth, canvasHeight)

    # calculate origin position
    x = (canvasWidth - boxWidth) * 0.5
    y = boxY + abs(f.info.descender) * glyphScale

    # collect horizontal metrics
    guidesX = {x, x + boxWidth}

    # --------
    # draw box
    # --------

    save()
    fill(0.9)
    rect(x, boxY, boxWidth, boxHeight)
    restore()

    # -----------
    # draw guides
    # -----------

    save()
    lineDash(6, 3)
    stroke(0.5)

    # draw guides x
    for guideX in guidesX:
        line((guideX, 0), (guideX, height()))

    # draw guides y
    for guideY in metricsY:
        guideY = y + guideY * glyphScale
        line((0, guideY), (width(), guideY))

    restore()

    # ----------
    # draw glyph
    # ----------

    save()
    fill(None)
    stroke(0)
    strokeWidth(5)
    lineJoin('round')
    translate(x, y)
    scale(glyphScale)
    drawGlyph(g)
    restore()

    # ------------
    # draw anchors
    # ------------

    radius = 10
    save()
    fill(None)
    stroke(1, 0, 0)
    translate(x, y)
    for anchor in g.anchors:
        aX, aY = anchor.position
        aX *= glyphScale
        aY *= glyphScale
        oval(aX - radius, aY - radius, radius * 2, radius * 2)
        line((aX - radius, aY), (aX + radius, aY))
        line((aX, aY - radius), (aX, aY + radius))
    restore()

    # ------------
    # draw caption
    # ------------

    captionX = captionSize
    captionW = width() - captionSize * 2
    captionH = captionSize * 2

    save()
    font('Menlo-Bold')
    fontSize(captionSize)
    fill(*captionColor)

    # top
    captionY = height() - captionSize * 3
    captionBox = captionX, captionY, captionW, captionH
    textBox(g.name, captionBox, align='left')
    if g.unicode:
        uni = str(hex(g.unicode)).replace("0x", '')
        uni = uni.zfill(4).upper()
        textBox(uni, captionBox, align='right')

    # bottom
    captionY = 0
    captionBox = captionX, captionY, captionW, captionH
    textBox('%.2f' % g.width, captionBox, align='center')
    if g.bounds:
        textBox('%.2f' % g.leftMargin, captionBox, align='left')
        textBox('%.2f' % g.rightMargin, captionBox, align='right')

    restore()
This example could be extended to display other types of data, such as on-curve and off-curve points, blue zones, etc.